A single data point is already big data
This year I’ve had the pleasure of participating as a provocation presenter in the annual VIS4DH (6th Workshop on Visualization for the Digital Humanities), as part of the IEEVIS 2021 program.
The workshop is organized around paper presentations interwoven with provocations: short 5-minute talks where presenters would make the case for any strongly-held viewpoint.
This year’s theme was “The Politics of Scale”, reflecting on the roles visualization plays in a scale-confounding world. Amazing papers were presented as well as a great keynote talk by Yanni Loukissas, and I strongly recommend checking it out.
I’ve contributed by presenting the following provocation, aligned with my research interests – and beautifully illustrated with the artwork of Anders Hoff, who I’m a huge fan of.
The provocation I’ll be presenting today is titled “A single data point is already big data”, with doctor Doris Kosminsky as my advisor.
Our relationship with the data we collect about this planet and how we choose to represent it has profound impacts on our understanding of the world and its inhabitants.
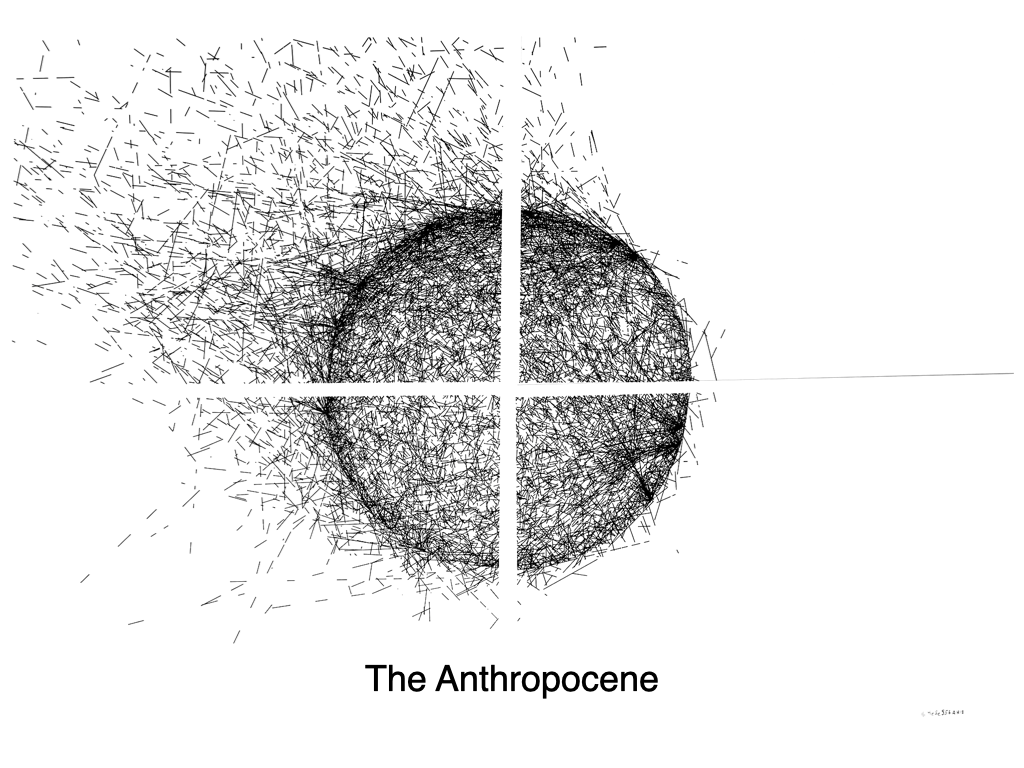
The impending and ever more present threat of the climate crisis brings upon the dawn of the Anthropocene – a new geologic era in the history of the planet marked by the scale and reach of human impact over Earth’s systems.
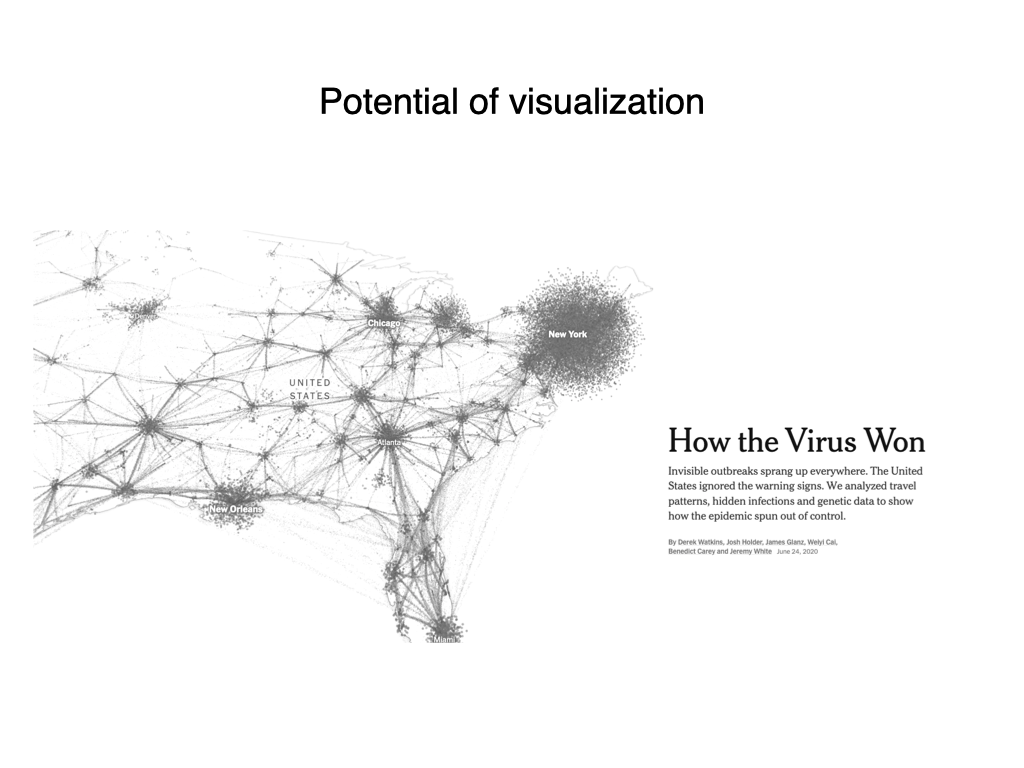
Practitioners and researchers may be well aware of the potential of visualization to bring insights and enable human cognition over complex matters.
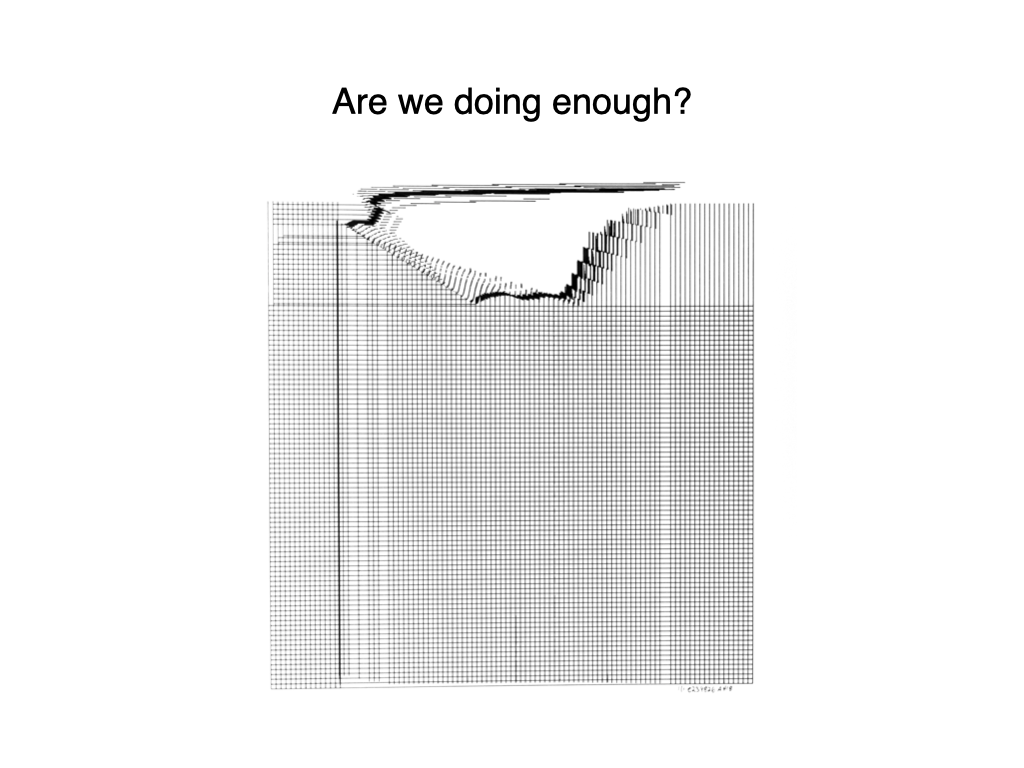
But how are we visualizing the scale of the challenges facing us?
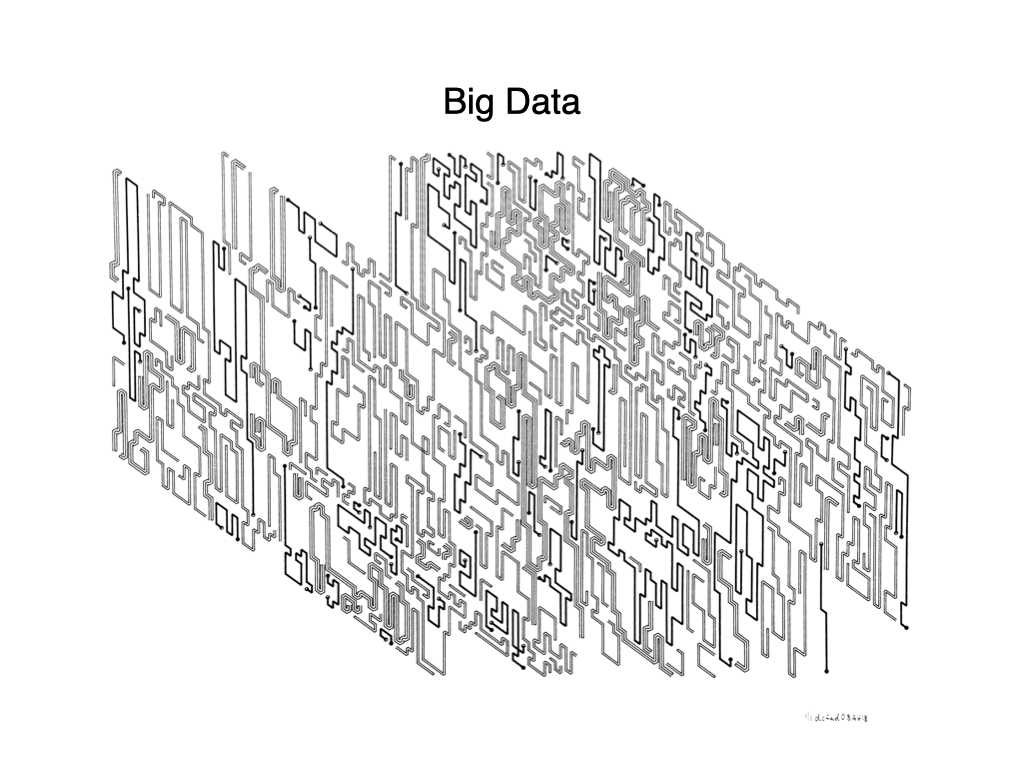
When representing massive realities, one can’t help but think of massive data, or more appropriately, big data: huge, multilayered multidimensional datasets which seem to replicate the very structure of the climate’s feedback loops – a series of deeply interconnected subjects, events, and agencies.
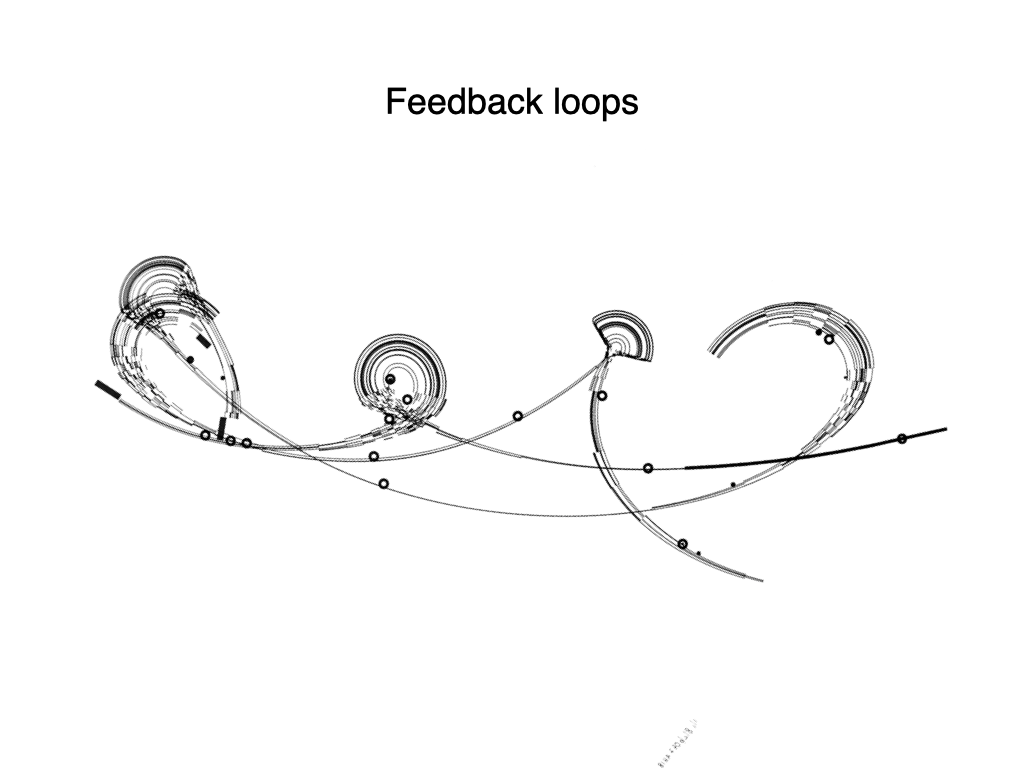
An increase in temperature here, for example, leads to a melting of glaciers there, releasing permafrost gases, increasing the temperature even more and eventually affecting humidity, crops, which by themselves affect other systems, and so on.
The realities facing us are massive not only in their interconnectivity but in their reach – both in space and time. Plastic pollution, for example, is a reality we can visualize in images of littered shores, but it extends far beyond that. It’s in microplastics in sewers and flowing through ocean currents, sitting in the stomachs of fish and humans, and drifting in our atmosphere, in the very air we breathe. A product of larger plastics breaking down, again and again, these microscopic particles can take hundreds or thousands of years to decompose, outliving all those who worked to bring them into existence and who would actually make use of this material.
In this way, a single plastic bottle that may sit on your desk is merely a local manifestation of a larger phenomenon, a larger object, always out of reach, defying visualization.
However massive these realities are, many of our encounters with climate data in everyday life are actually with modestly sized datasets, easily explorable through regular tools. By themselves, these medium-sized data already present significant challenges to the audience’s understanding of the scale and urgency of the problem.
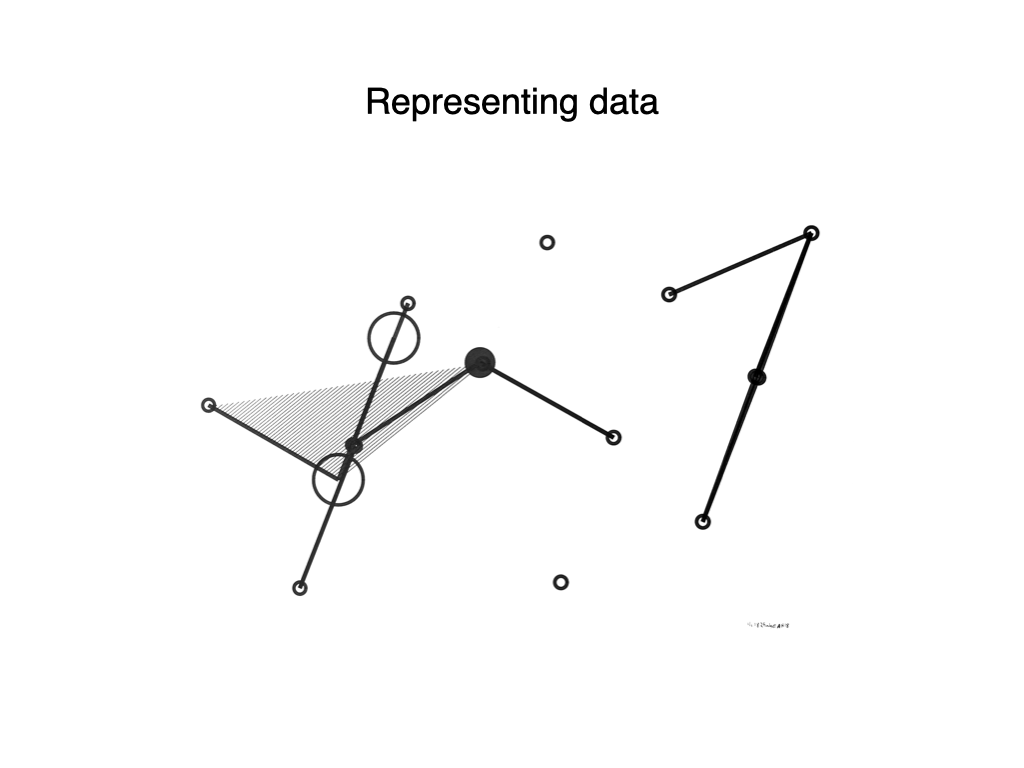
Single data points, such as one record of temperature measurement at a climate station are embedded in an intricate mesh of relationships with other points of data, living organisms, and phenomena. And so it directly affects – and is affected and generated by – its surroundings.
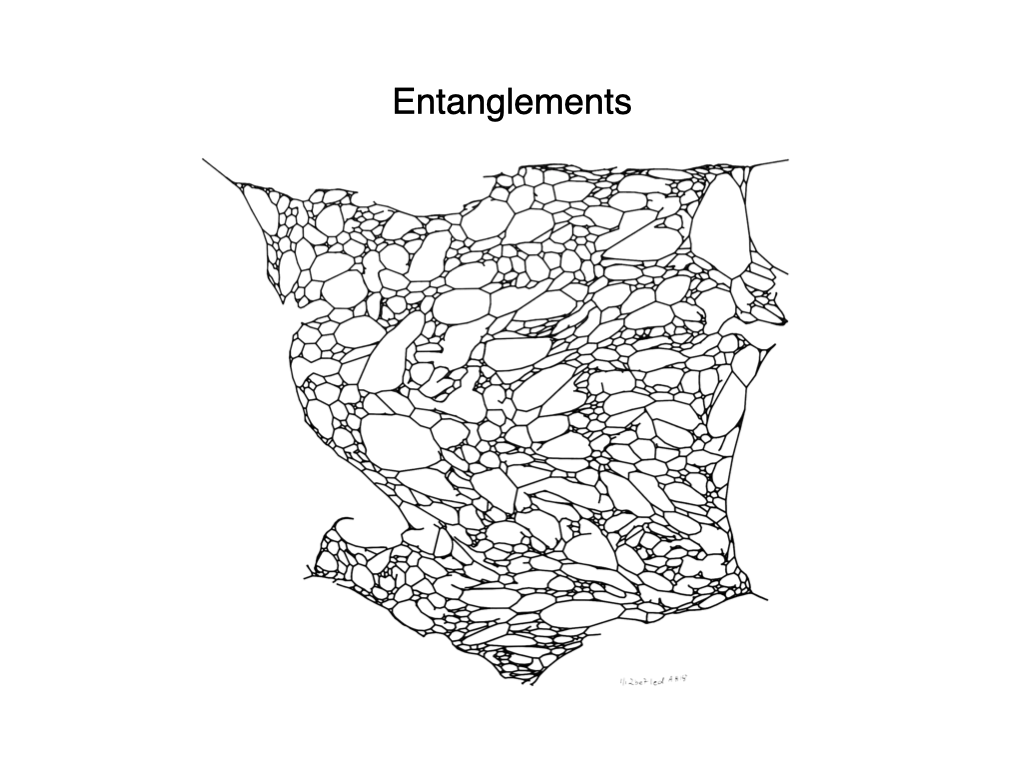
These types of winding relations and entanglements are natural to organic life but seem to challenge our cognition and ways of organizing and seeing the world. Representing realities that span timescales ranging from milliseconds to millennia, from millimeters to kilometers, may require us to think not in terms of bigger data, but actually to think smaller.
Data humanism could be useful as a response to this problem, prioritizing human scale and cognition as the metric by which we should evaluate our data efforts.
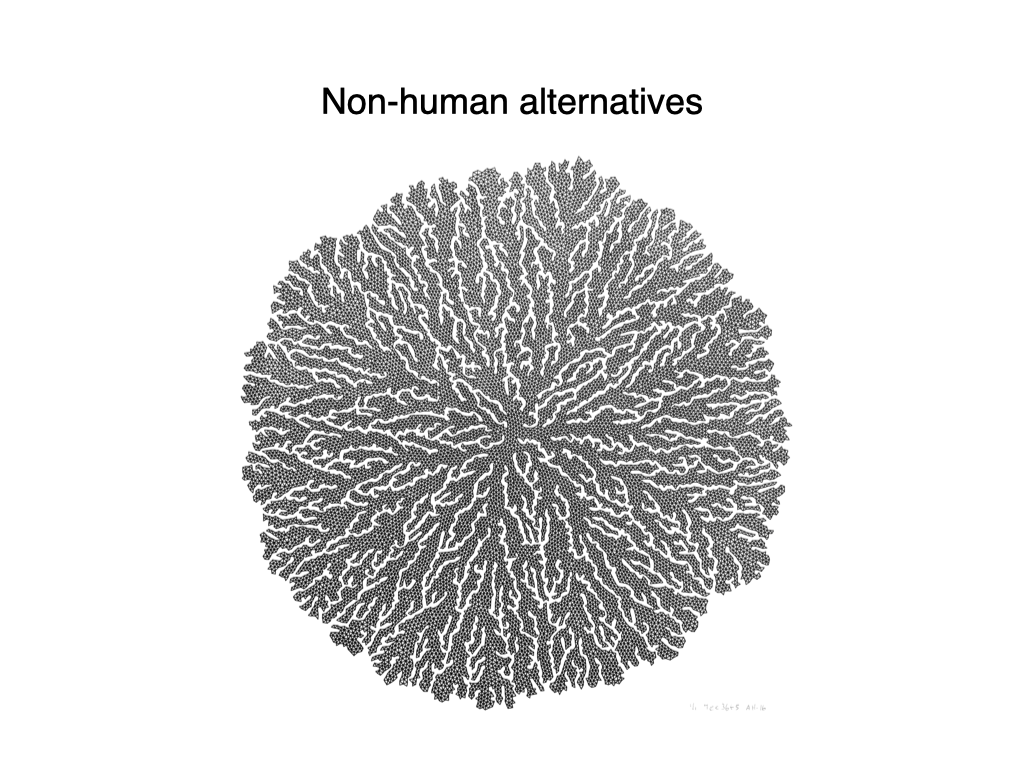
Simultaneously, as a way to address this limitation in our understanding, the humanities have been attempting to shift perspectives from the human-centered planet towards non-human alternatives, recognizing the agency of fauna, flora, and fungi.
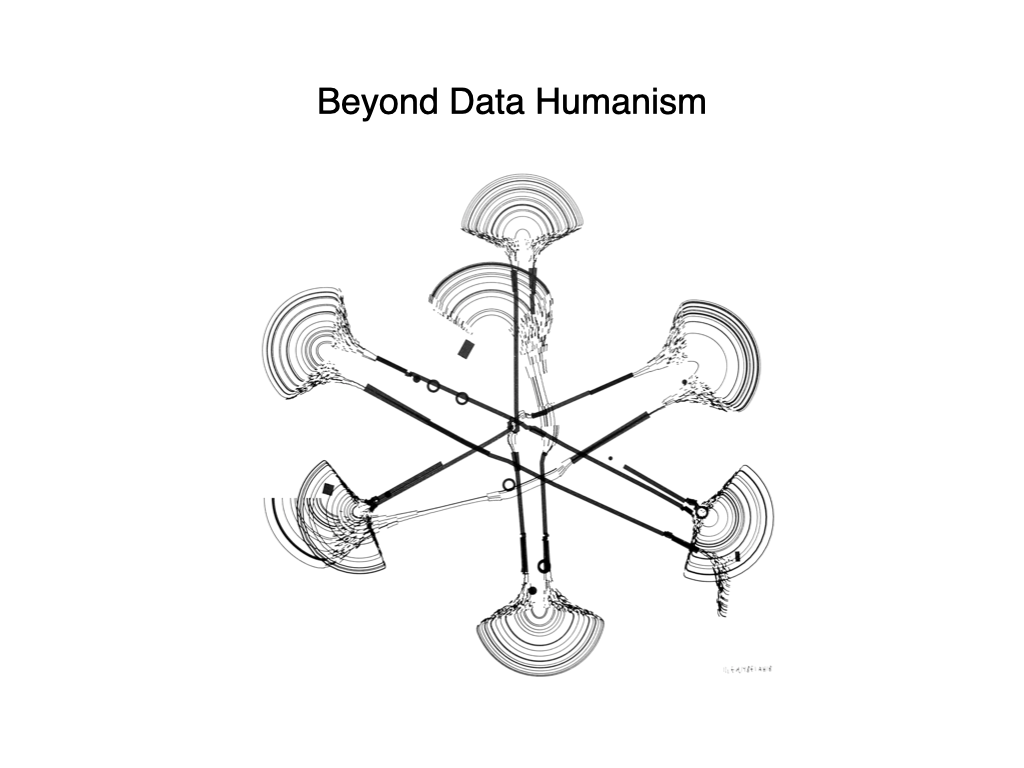
Could we imagine a framework beyond data humanism, focused on the planet’s scale and its network of relationships – and what would that look like?
We urgently need to communicate these concerns through our visualizations, question how our choices address the scale of the crisis, the entanglement of life on Earth, and push ourselves to imagine data beyond humanism so that the infinitely complex can be understood and inhabited.